Minggu, 03 Mei 2009

Tugas Normalisasi


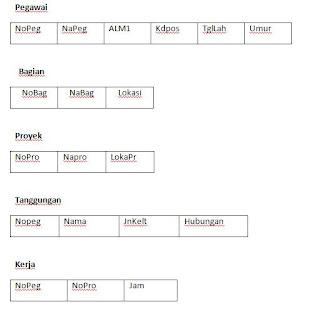
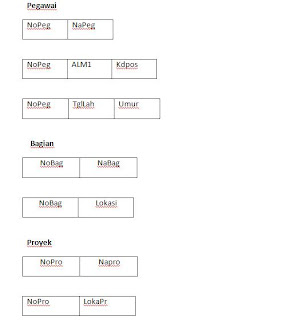
Mapping of ERD image above:


1NF/First Normal Form

A form of normal relations, said the first, if and only if every attribute value for every single line. Each field is only one definition, is not a collection of words that has two meanings, one meaning only and not the fraction is also the word - th

e word means so that the other. There is no set of attributes that\ repeatedly or attribute double value.


2NF/Second Normal Form

Second Normal form (NF 2) is:

1). Meets 1 of NF (normal first).
2). Non-key attributes must depend on the function key / primery key.
So that the second normal form for each table / file must be specified attribute keys.


3NF/Third Normal Form

Definition of Third Normal Form (NF 3) is:
1). Meet the 2 forms of NF (both normal).
2). Non-key attributes do not have a transitive dependency on the key / key primery.


Minggu, 26 April 2009

Database Normalization

There are several processes that must be done to design a database, namely:

1. Gathering user needs / business

2. Develop the ER model based on user needs / business

3. Converting E-R Model to relationship gathering ( of tables )

4. Relationship normalization to eliminate the anomaly

5. Implementation to database by making table to each; every relationship is normalization

Normalization of Data Bases

Normalization is process of forming of structure of data bases so that most ambiguity can be eliminated. Normalization Phase started from lightest phase ( 1NF ) tightest till ( 5NF). Usually only come up with the storey; level 3NF or BCNF of because have adequate enough to yield the tables which good with quality.

Normalization should be performed for the optimal structure-structure of the table, Increase speed, remove the same income data, more efficient use of storage media, Reducing redundancy, Avoiding anomalies (insertion anomalies, deletion anomalies, update anomalies), improved data integrity.

A tables told by goodness if fulfilling 3 criterion :

· If there is decomposition of is tables of, hence decomposition have to be secured ( Lossless-Join Decomposition

· The looking after of functional depending at the (time) of data change ( Dependency Preservation).

· Don’t impinge the Normal Boyce-Code of Form ( BCNF)

If the three criteria (BCNF) can’t be met, then at least the table does not violate the Normal Form of the third stage (3rd Normal Form / 3NF).

Functional Dependency

Functional Dependency attributes describe the relationship in a relationship. An attribute said functionally dependant on the other, if we use the value attribute to determine the value of the other attributes.

· Symbol used is (→) to deputize the functional dependency

· Notation: A B

“A” And “ B” is attribute from a tables. Mean functionally A determine the B or B of depend on A, if and only if there is 2 data line with the same value A, hence assess the B also is of equal

· Notation: A / B Or A x B

Is reverse from previous notation.

Functional Dependency (FD)


·


NRP -> Name

· Mata Kuliah, NRP-> Value

Non Functional Dependency:

· Mata Kuliah -> NRP

· NRP -> Value


Functional Dependency from tables of value

· Nrp -> Name
Because for each value Nrp the same, then the value of the same name

· (Mata_kuliah, NRP) -> Value
Because the value of attributes depending on the NRP and Mata_kuliah together. In another sense Mata_kuliah for the NRP and the same, they also rated the same, because Mata_kuliah and the NRP is a key (is unique).

· Mata_kuliah -> NRP

· NRP -> Value

FIRST NORMAL FORM (First Normal Form - 1NF)


A table on the form said to be normal if I did not reside in the unnormalized form of a table, where there is a kind of field multiplication and field that allows a null (empty) not allowed:

  • Attribute values, many (Multivalued attributes).
  • Attribute a composite or a combination of both.

So:

  • Price is the domain attribute must be atomic rates

Example:

  • Ex Student Data as follows:

Ex Student Data as follows:


Second Normal Form - 2NF

Normal form 2NF fullfiled in a tables of if have fulfilled the form 1NF, and all attribute of besides primary key, intactly own the Functional Dependency of at primary key. A tables

do not fulfill 2NF, if there is attribute which its depending only have the character of the just just parsial ( only depend on some of primary key) . If there are attribute which do not own the depending to primary key, hence the attribute have to be moved or eliminated.

- Functional depending of X Y told by full of if vanishing a attribute A from X mean the Y shall no longger hinge functional.

- Functional depending of X Y told by partial of if vanishing a attribute A from X mean the Y still hinge functional.

- Scheme of Relationship R in the form of 2NF if each every attribute of is non primary key A R hinge full of by fungsional at primary key R.

- Tables in the following is fulfilling 1NF, but [do] not the inclusive of 2NF :

{NIM, KodeMk} NameMhs

{NIM, KodeMk} Address

{NIM, KodeMk} Matakuliah

{NIM, KodeMk} Sks

{NIM, KodeMk} LetterValue

- The tables require to decomposition become some up to standard tables 2NF


· Functional dependency:

{NIM, KodeMk} LetterValue (fd1)

NIM {NameMhs, Address} (fd2)

KodeMk {Matakuliah, Sks} (fd3)

· becoming :

fd1 (NIM, KodeMk, LetterValue) Tables Value

fd2 (NIM, NameMhs, Address) Tables of student

fd3 (KodeMk, Matakuliah, Sks) Tables MataKuliah


Third Normal Form - 3NF

Normal form 3NF fullfiled by if have fulfilled the form 2NF, and otherwise there is attribute of is non primary key owning depending to attribute of is non primary key the other ( depending transitif)

· So that the tables require to didekomposisi become.:

· Student (NIM, NameMhs, Jalan, KodePos)

KodePos (KodePos, Provinsi, Town)


Boyce-Codd Normal Form (BNCF)

Boyce-Codd Normal Form constraint has a stronger form of the Normal third. To be BNCF, relations must be in the form of Normal To one and forced each of the attributes depends on the function in the super key attributes.


In the example below there is a relationship seminar, is the Primary Key NPM + Seminar.
Students may take one or two seminars. Each seminar requires 2 each of the students and l

ed by one of the 2 seminar. Each leader can only take one seminar course. NPM in this example and show the seminar.


Relations Seminar is a form of Third Normal, but not BCNF. Seminar Code because the function depends on the teach, if any teach can only teach a seminar. Depending on the seminar isn’t a super key attributes such as required by BCNF. So seminar relations must be parsed into two namely:


Fifth and fourth Normal form

  • Relations in fourth normal form (NF 4) if the relation in BCNF and does not contain a lot of dependence values. To remove the dependency of many values from a relation, we divide the relationship into two new relations. Each relation contains two attributes that have a lot of relationship value.
  • Relations in fifth normal form (5NF) deal with the property called the join without any loss of information (lossless join). Fifth normal form (also called the 5 NF PJNF (projection join normal form). The case is very rare and appear difficult to detect in practice.

References:

Er Ngurah Agus Sanjaya. Slide Part 6 - Normalisasi.

Sabtu, 18 April 2009

DATABASE AND ER-DIAGRAM

DATABASE AND ER-DIAGRAM

DEFINITION OF THE DATABASE:

A set of data stored in the magnetic disk, optical disk or other secondary storage. Collection of integrated data-related data of an enterprise (company, government or private). for example:

1. Company data > manufacturing production planning, actual production data, data ordering materials, etc.

2. Hospital > patient data, doctor, nurse, etc.

DATABASE MANAGEMENT SYSTEM

DBMS is a system and the data base on the computer. This system is designed to be able to do a variety of data with some reference data are the same. DBMS is able to access various applications.

BIT, BYTE, FIELD

1. >>Bit is the smallest pieces of data that contains the value 0 or 1

2. >>Byte is a set of bit-bit similar

3. >>Field is a set of byte-byte similar, in the database used the term attribute


ATRIBUT/FIELD

It is the nature or characteristics of an entity that provides provide detail on these entities. A relationship can also have attributes.

Examples for attributes:

STUDENTS: NIM, NAME, ADDRESS

CAR: NOMOR_PLAT, COLOR, TYPE, CC

TIPE-TIPE ATRIBUT

Single vs multivalue

Single > can only be filled at most one value

Multivalue > can be filled with more than one value with the same type of

Atomic vs composition

Atomic > can’t be divided into the attributes of smaller

composition > is a combination of several attributes of a smaller

Derived Attribute

attribute value can be derived from other attribute values, for example: age of the attributes generated from the date of birth.

Null Value Attribute

Attributes that have no value to a record

Mandatory Value Attribute

Attributes must have values

RECORD/TUPLE

It is a line of data in a relationship, and consists of a set of attributes where the attribute is to inform each other entity / relationship fully.

ENTITY/FILE

File is a collection of similar records and have the same elements, the same attributes but different data value.

File Type

File is a collection of notes and similar elements have the same, the same attributes but different data values. In the process of application, the file can be in the category with some of the following types

1. Master File

2. Transaction File

3. File Report

4. File History

5. File Protection

6. File Work

DOMAIN

Domain is the set of values that are allowed to reside in one or more attributes. Each attribute in a database relasional is defined as a domain.

KEY DATA ELEMENT

Key elements of record which is used to find these records at the time of access, or can also be used to identify each entity / record / line.

SPECIES OF KEY

Superkey

is one or more attributes of a table that can be used to identify entityty / record of the table are unique (not all attributes can be superkey).

Cadidate Key

is a super key with minimal attributes. Candidate must not contain a key attribute of the table so that the other candidate key is certain superkey but not necessarily vice versa.

Primary Key

One of the key attributes of the candidate can be selected / specified a

primary key with the three following criteria:

1. Key is more natural to use as reference

2. Key is more simple

3. Key is guaranteed unique

Alternate Key

is an attribute of the candidate key is not selected to be primary key.

Foreign Key

is any attribute that points to the primary key in another table. Foreign key will be going on a relationship that has kardinalitas one to many or many to many. Foreign key is usually always put on the table that point to many.

External Key

is a lexical attribute (or set of lexical attributes) that values are always identify an object instance.

ERD (ENTITY RELATIONSHIP DIAGRAM)

ERD is a model of a network that uses word order is stored in the abstract system.

Differences between the DFD and ERD:

- DFD is a model of network functions that will be implemented by the system

- ERD is a model that emphasizes the network data on the structure and relationship data

ELEMENTS OF THE ERD

Entity

In the ER Diagram Entity is described with the form of a rectangle. entity is something that exists in the real system and the abstract where the data stored or where there are data.

Relationship

ER diagram on the relationship can be described with a lozenge. Relationship is a natural relationship that occurs between entities. In general, the name given to the verb base making it easier to do readings relationships.

Relationship Degree

is the number of entities participating in a relationship. Degree which is often used in the ERD.

Attribute

is the nature or characteristics of each entity and relationship

Kardinalitas

tupel indicates the maximum number that can be berelasi with entities on the other entity

RELATIONSHIP DEGREE

Unary Relationship

model is the relationship between the entity originating from the same entity set.

Binary Relationship

model is the relationship between 2 entities.

Ternary Relationship

is a relationship between the instance of 3 types of entities are unilateral.

KARDINALITAS

There are 3 kardinalitas relations, namely;

One to One:

Level one to one relationship with the one stated in the entity's first event, only had one relationship with one incident in which the two entities and vice versa.

One to Many or Many to One:

Level one to many relationship is the same as the one to many depending on the direction from which the relationship is viewed. For one incident in the first entity can have many relationships with the incident on the second entity, if the one incident in which two entities can have only one incident hubugan with the first entity.

Many To Many:

if any incident occurs in an entity has many relationships with other entities in the incident.

EXEMPLARY KARDINALITAS


NOTATION (E-R DIAGRAM)

Symbolic notation in the ER diagram is:

1. Rectangle represent the collective entity

2. Circle represent the attributes

3. Rhomb represent collective relationships

4. Line as the set of relations between the Association and the collective entity with entity attributes

Reference:

ER Ngurah Agus Sanjaya. Slide Part 5 - Database Dan Er-Diagram.

Sabtu, 04 April 2009

DATA FLOW DIAGRAM

DATA FLOW DIAGRAM

Data flow diagram is also called the Data Flow Diagram (DFD).DFD function to describe the existing system or the new system will be developed without considering the logic of the physical environment where the data flows, or where data disimpan.DFD can also explain the flow of data in the system with a clearly structured.

Context Diagram

1. Consists of a process and describe the scope of a system

2. Is the highest level of the DFD that describes the entire system to input and output of the system

3. System is limited by Boundary (depicted by broken lines)

4. There may not be storage (storage)

Zero Diagram

Zero diagram is a chart that describes the process of DFD. This diagram provides a view of the overall system shows that the main function of the process or the flow of data and the external entity. At this level there is a data storage.

Detailed Diagram

Is a diagram that decipher what is the process in the diagram zero level or above.

Numbering level in the DFD:


In one level there should be no more than 7 units and the maximum of 9, when more should be done in the decomposition.

Specification Process

Each process in the DFD must have a top-level specification process . method that is used to describe the process can use a sentence with descriptive, and on a more detailed level, namely on the bottom (functional primitive) require a more structured specification, process specification will be the guidelines for a programmer to create the program.

External Entity

Unit outside is something that is outside the system, but provide data in the system or to provide data from an external system. Entity not including part of the system, the symbols with the notation.

Rules for naming:

1. The name of the form of noun

2. Terminal may not have the same name unless the object is the same

Data Flow

Data flow is the information flow is depicted with a straight line that connects the components of the system. Data flow direction is indicated with arrows and lines give the name on the flow of data flow. Flow data that flows between processes, data storage and data flow indicates that the form of data input to the system.

Guidelines of the name:

1. Name of the flow of data that consists of some words associated with the flow lines connect

2. No flow data for the same and the name should reflect its content

3. The flow of data that consists of several elements can be expressed with the group element

4. Avoid using the word 'data' and 'information' to give a name to the flow of data

5. Wherever possible the complete flow of data is written

Other provisions:

1. Name of the flow of data into a process may not be the same as the name of the data flow out of the process

2. Data flow into or out of data storage doesn’t need to be given a name if:

a. The flow of data simple and easy to understand

b. Describes the data flow of all data items

3. There can be no flow of data from the terminal to the data storage, or vice versa because the terminal is not part of the system, the relationship with the terminal data storage must be through a process

Process

The process is what is done by the system, can process data streams or input data into output data stream. Each process has one or more inputs and produce one or more output.

Transform the process of working one or more of the input data into one or more of the output data in accordance with the desired specifications.

Guidelines of the process:

1. Name of the process consists of a verb and noun, which reflects the function of the process

2. Do not use the process as part of the name of a bubble

3. May not have some process that has the same name

4. The process should be given a number. Order number wherever possible to follow the flow of the process or sequence, but the sequence number doesn’t mean that the absolute is a process in chronological order

Data Storage

Data storage is a storage place for data that exists in the system, which symbol with a pair of parallel lines or two lines with one of the side open. The process can retrieve data from or provide data to the database.

Guidelines of the name:

1. The name should reflect the data.

2. When his name more than one word must be marked with the numbers.

Data Dictionary

Data Dictionary functions to help the system to interpret the application in detail and manage all elements of the data used in the system right so that the system analyst and have a basic understanding of the same input, output, storage and processing.

At analysis, the data dictionary is used as a means of communication between the systems analyst with the user. At the system design, data dictionary is used to design input, reports and databases.

Data dictionary contains the following:

1. Name of data flow: must note that readers who need further explanation about a flow of data can find it easily

2. Alias: initials or other name of the data can be written when there is

3. Forms of data: used to segment the data dictionary to use when designing the system

4. Flow data: indicates from which data flows and where the data

5. Description: to give an explanation of the meaning of the data flow

Balancing In DFD

The flow of data into and out of a process must be the same as the flow of data into and out of the details of the process on the level or levels below it. Number and the name of an entity outside the process must be equal to the number of names and entities outside of the details of the process.

The issues that must be considered in the DFD which have more than one level:

1. There must be a balance between input and output of one level and next level

2. Balance between level 0 and level 1 at input output of the flow of data to or from the terminal on level 0, while the balance between level 1 and level 2 is seen on the input / output of stream data to and from the process concerned

3. Name of the flow of data, data storage and terminals at each level must be the same if the same object

Restrictions In DFD

1. Flow data may not be from outside the entity directly to other outside entities without going through a process

2. Flow data may not be from the savings directly to the data to outside entities without going through a process

3. Flow data may not be saving the data directly from the savings and other data without going through a process

4. Flow data from one process directly to the other without going through the process of saving data should be avoided as much as possible

Reference:

ER, Ngurah Agus Sanjaya. Slide presentation Part 4 - Data Flow Diagram.

Jumat, 27 Maret 2009

quiz 4

FIRST OBSERVATION AND ANALYSIS REQUIREMENT

Investigational System Concept

The problem is the gap in goal difference between the system and the actual system conditions.

Many reports on the detection problem may not be real,because of several things:

1. A goal that is too ideal, too difficult to achieve

2. Lack of resources and or attitude

3. Measurement system is less accurate

4. System that is the purpose behind Goal system that is out of date

5. The difference between the system and the system idel while

Problem solving:

1. Description of the condition of the system that runs through it in detail

2. Getting a consensus that the ideal system

3. Developed several alternative

4. select the best alternative

For the purpose of the investigation indicate that problems are actually happening

Constraints in the system of investigation

Investigations in several problems that often appear are:

1. Time

2. Cost

3. Knowledge

4. Politic

5. Intervention

Recommendations

Results of the investigation is a recommendation that contain, among others:

- Not to take any action because they are not finding a problem

- Perform system maintenance for a small problem.

- Improving the skills or the ability to use the system

- Consider modifications to the system in full

-Putting the problem to occur in the development plan system is carried out immediately

Investigation Tactics

Why we need tactics?

- Finding a problem for all

- Knowing for the emergence of problems

- for Determining the right solution

Investigative tactics need to be done by all elements of the system in order to receive offer solutions without disrupting their activities.

Some of the tactics that can be done:

- Listen to the user's system

- Don't give the early breakthrough

- Compare the stories of some of the user system the same case

- Note the logical inconsistency problem

Investigation Technique

Direct (internal):

1. The questionnaire

2. discussion

3. Observation

Indirect (external):

1. Flow of the procedure

2. Reviewing documents

3. Sample

4. Tabular

Current System Description

1. Inputs

2. Outputs

3. Files

4. Data elements

5. Transaction and document action volume

6. Data flow diagrams

Requirement Analysis

phase of intensive interaction between the systems analyst with the end user where the system shows the development team expertise to get feedback and trust so that the user get a good participation.

4 goals want to achieve:

1. Explain the complete system

2. Information system that describes the ideal

3. Bringing information system to the ideal conditions at this time with attention to resource constraints

4. Providing encouragement to the user's confidence in the system development

Method Needs Analysis

1. discussion

2. Questionnaires

3. Observation

4. Procedure Analysis

5. Observation documents

Resource constraints

1. Time

2. Money

3. Expertise

4. Technology

5. External factors

Needs Analysis Document

- Analysis direction: Relationships with end users, the observation process, problems in data collection

- The user needs: The need actual, reporting requirements, training needs and the influence of the new system

- System constraints: Explain the constraints of time and cost, expertise, technology, and

-external factors

- Documents such as data collection instruments, statistical consensus, the logical flow of

-data and phisik, data elements in the initial data dictionary.

Generating Systems Alternatives

How do I approach the condition of the system at this time with the condition of the ideal system?

- Creating an alternative to solve the problem of information system

- Best alternative is applied wisely

Options Strategies

- Distributed versus centralized processing

Changes in decision-making information from the centralized data processing to the end user Decentralized responsibility center

- Integrated versus dispersed database

System designer must consider the data are entered in the data base and into the file

- Surround Strategy of System Development

About important environmental strategy in the case of company takeovers because the

information system of other companies may vary with the company at this time.

Generating Systems Alternatives

Strategy Options

Options is done before the design operational

Designing Operational Options

Options can be grouped into the design

1. Input

a. Online Vs Off Line Data Entry

b. Keyed Vs Machine Readable Data Entry

c. Centralized Vs Decentralized Data Entry

2. Processing

a. Batch Vs Realtime record update

b. Sequential Vs Direct Access to records

c. Single Vs Multiple User update of records

3. Output

a. Traditional Vs Turn Around Documents

b. Structured Vs Inquiry based reports

Selecting The Proper System

Compare tactics: systems based on the comparison of costs and benefits relative; There are 3 ways the system "A" said the system is superior to the other if :

- "A" has a cost lower than "B" and their profit same.

- "A" has a cost lower than "B" and "A" result in more profits from the "B"

- "A" and "B" have the same costs but the resulting benefit "A" more.

Several Comparative Method System

1. Break Even point Analyisis

2. Payback Period

3. Discounted PayBack period

4. Internal Rate of Return

Cost category

1. Hardware

2. Software

3. People

4. Suppliers

5. Teleccommunications

6. Physical sites

Cost details

Comparing the cost of information systems through the life of the system, analysts projected the cost changes for the future and there are 3 models cost information system, namely Linear, and exponentially Step Function.

Information system cost happen in one time and be able happen continuous.

- Cost information system that occur only once the cost ontime and development costs that occur during the development of the system.

- Cost information system that occur continuously among reccuring cost and operational cost where the cost of this is the case when the operating system information every day.

The Information System Factor

Qualitative factors that lead the performance information system that both of them:

1. Reduce errors

2. Reducing the time to fix errors

3. Reduce the response time from the workstation alternative

4. Accelerate the time of providing information

5. Improve security systems

6. Propagate update records on the source

7. Increasing user satisfaction

Company Strategy Factor

1. Customer satisfaction

2. Sales increased

3. Consumer and vendor commitment

4. Information marketing products

Representation Learning System

1. Make short presentations

2. Reduce the detail description techniques

3. represented clearly with visual tools

4. If using a model using a tool such as a laptop so that more informative

5. Emphasize the benefits of the proposed system with some alternative information that is

appropriate conditions experienced by the company.

Decision to continue or No

- If the company decided to develop the information system, the department will do next, namely the System Design Process.

- If then the System Development Life Cycle (SDLC) will be terminated.

- Often the problem will be found with the system and the study and top management will usually ask for the re-employment system to study.

- Model will describe some of the stages of the repeated and sometimes the information will make a decision before the repeat stage system of study.

- With the alternative, the decision to repeat a previous stage SDLC or not called Go - No-Go Decision.